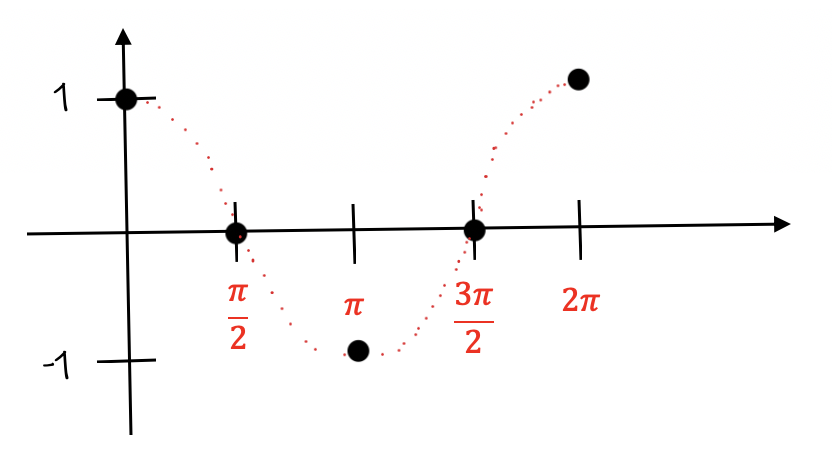
We will plot the 5 points on a graph and connect them together.
In this module, we will cover the method used to graph the sine and cosine functions.
Given a "Unit Circle", there are four main points that create the circle. A Unit Circle has a radius = 1 unit.
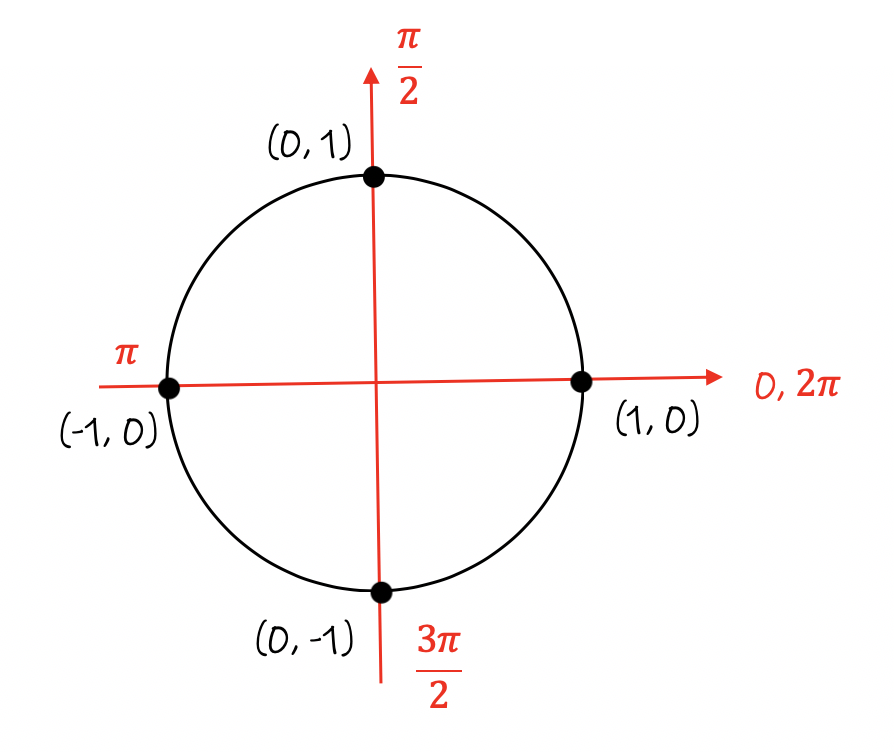 There are 4 main points that create the unit circle. Two on the x-axis and two points on the y-axis.
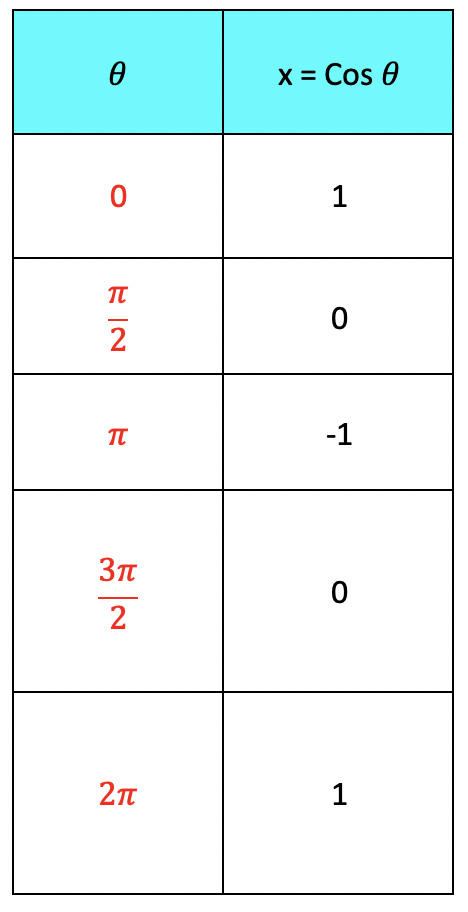
To graph the cosine function, we will use a table of values.
We will plot the 5 points on a graph and connect them together.
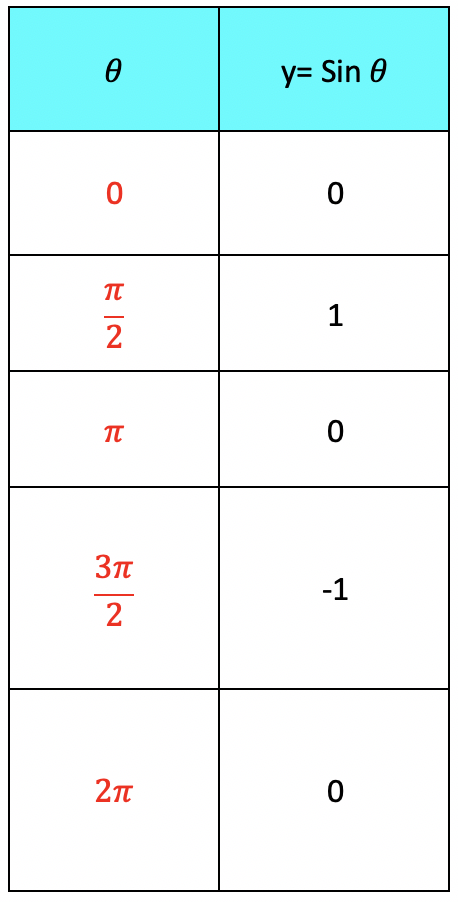
The Graph of the Sine Function
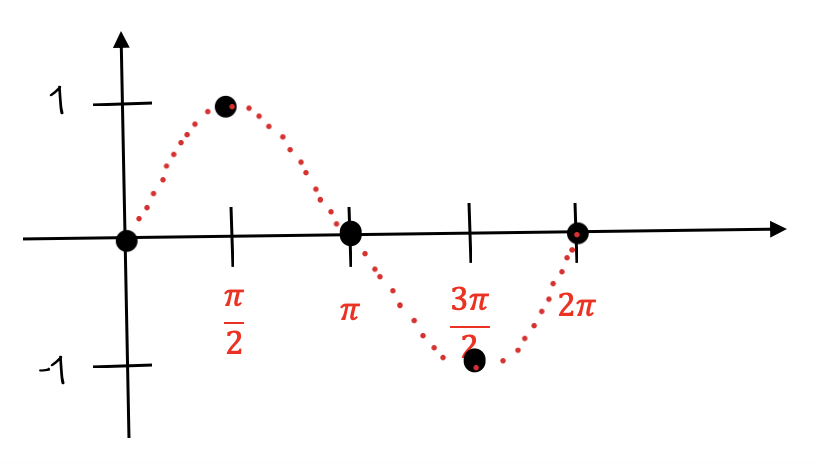
Notice each graph is drawn using curves to connect the points. The graphs look like a wave. It will always look the same when you graph each function.