The equation y = mx + b will always produce a graph of a perfectly straight line. The line may go upwards or downwards. It can even be horizontal or vertical!
There are two ways to graph a line when it's equation is written in slope-intercept form: y = mx + b.
1. Use a table of values
2. Use the intercept and the slope
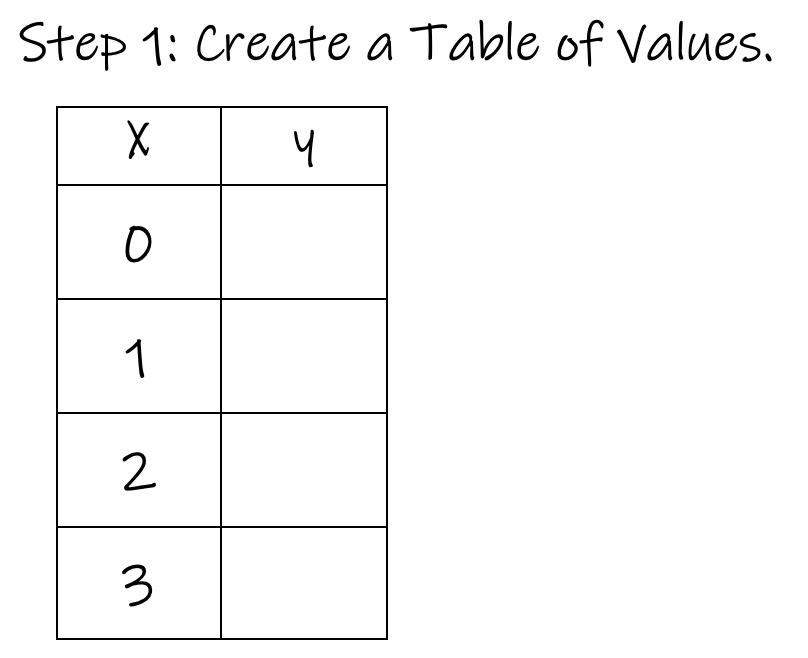
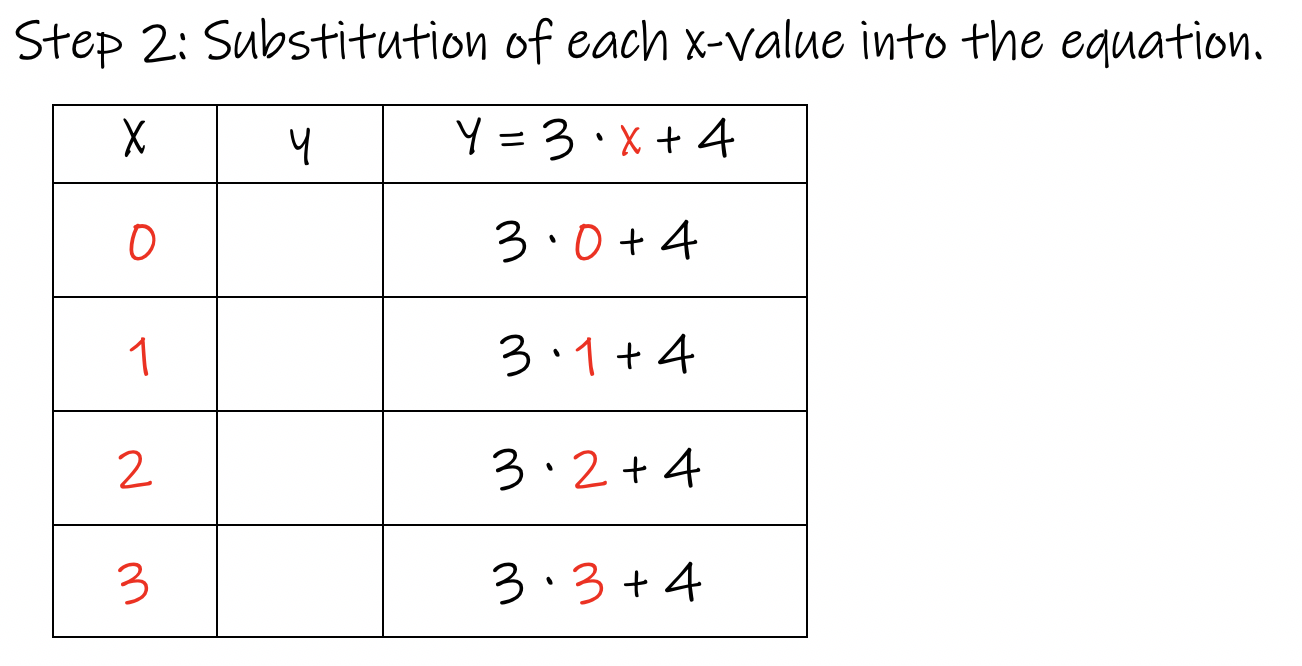
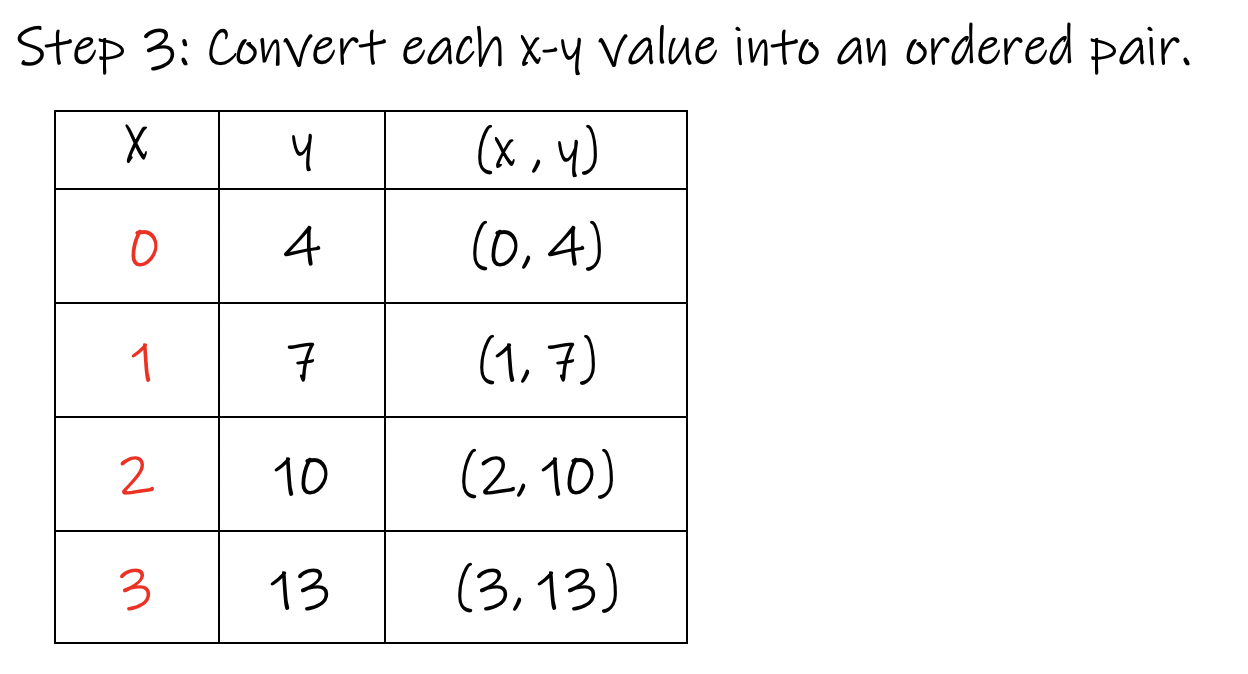
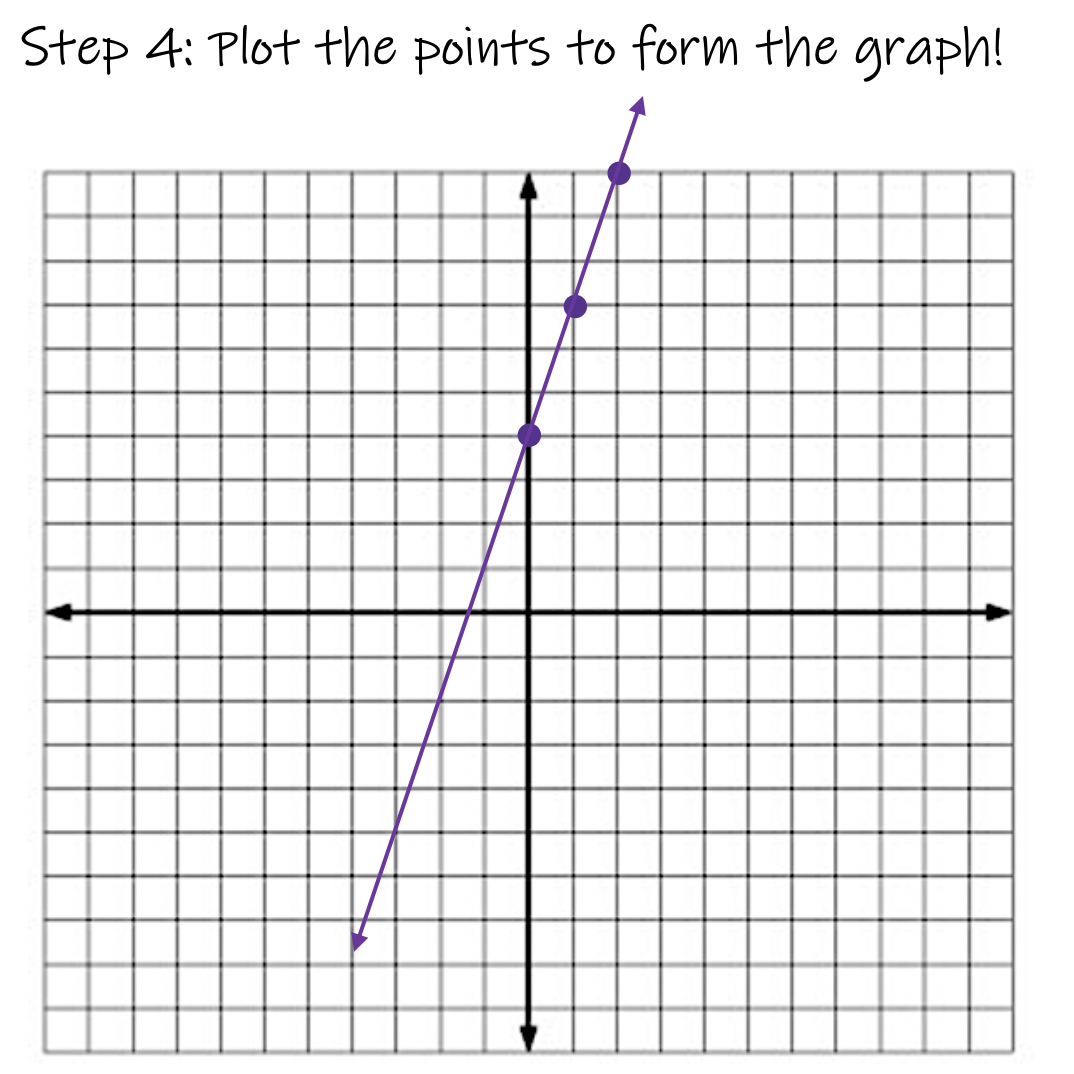
Creating a table of (x, y) coordinates to plot in order to create the image of the graph is the most common approach to graphing. You can pick as many x-values as you'd like, there is no limit. Each x-value gets substituted into the equation. The answer is always the y-coordinate. Together they create points (x, y) to plot on a coordinate axis to create your line.
Example 1: Graph y = 3x + 4
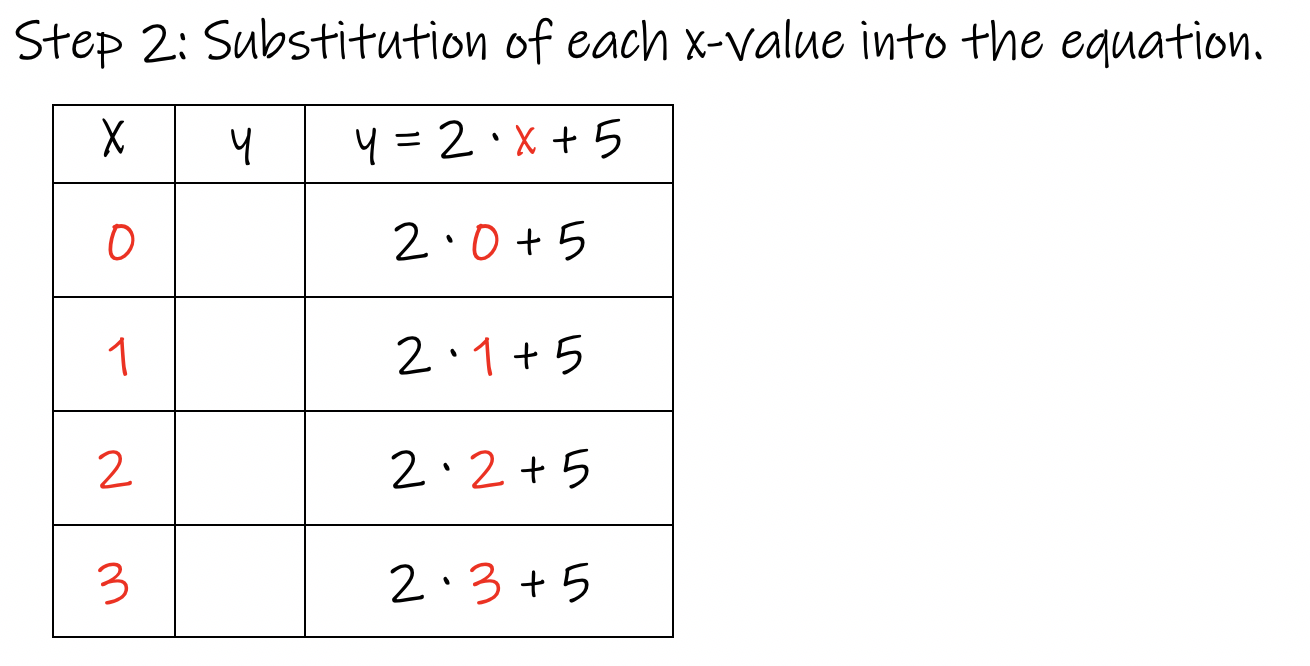
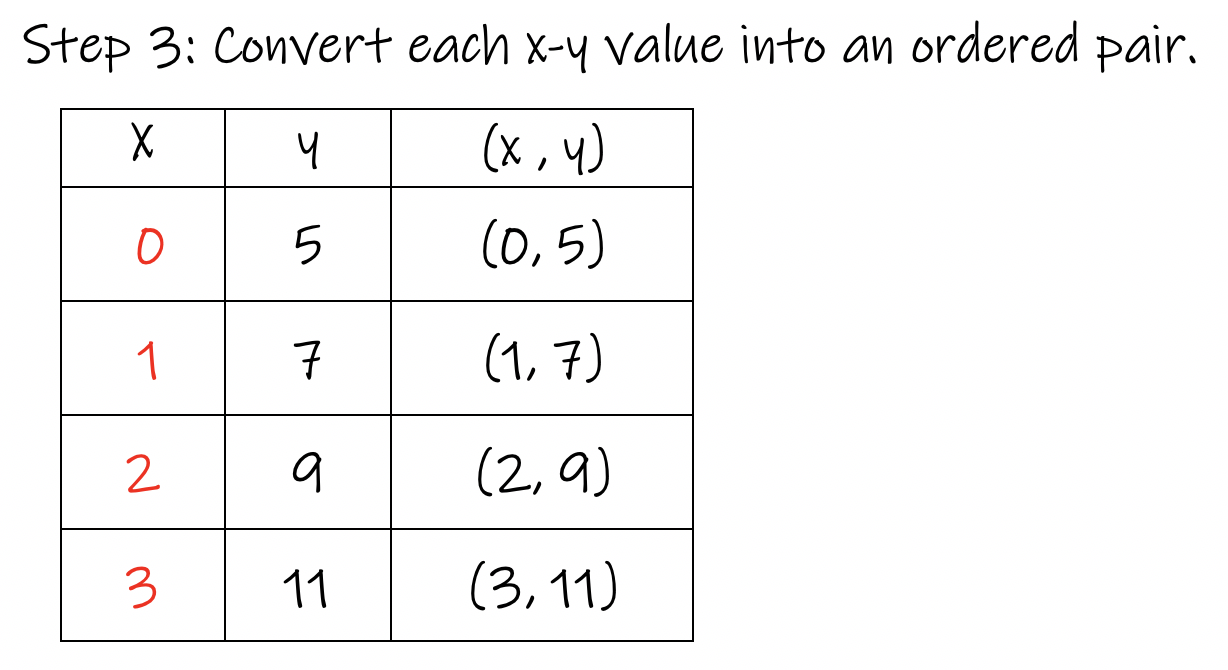
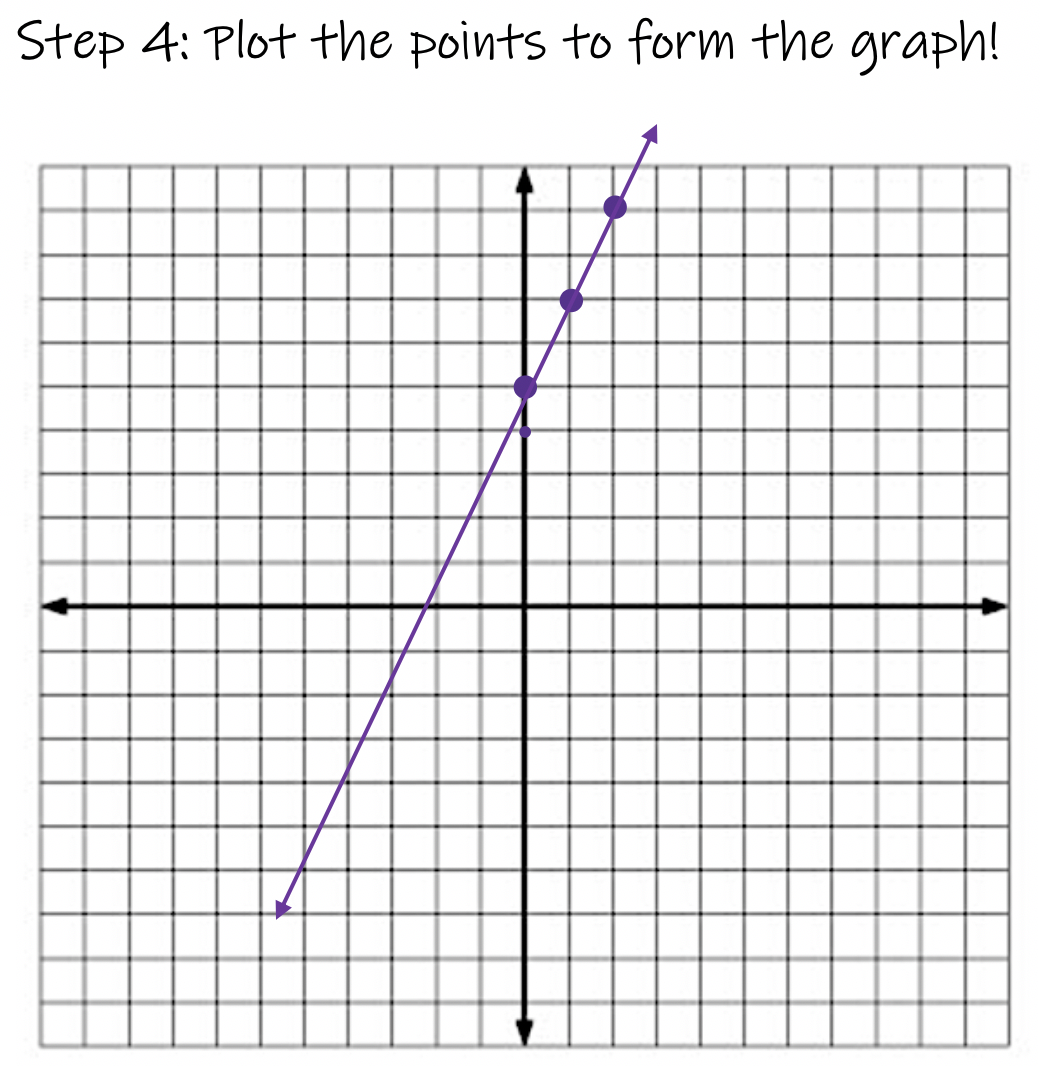
Example 2: graph y = 2x + 5.

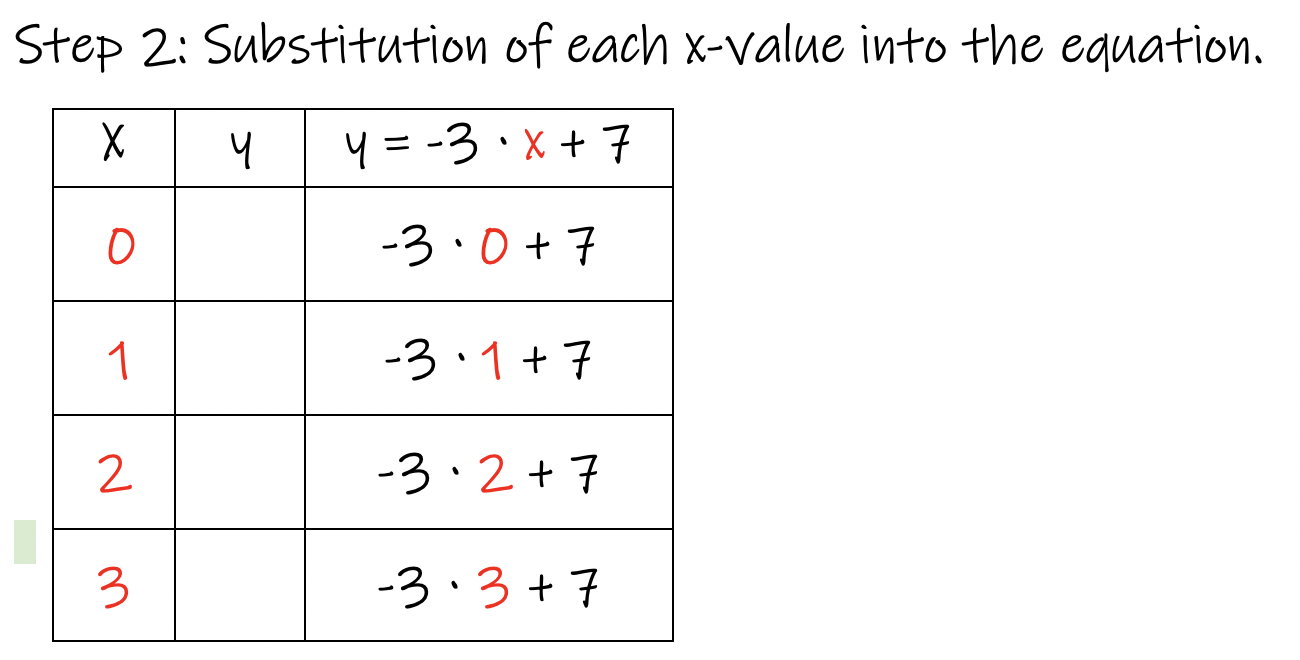
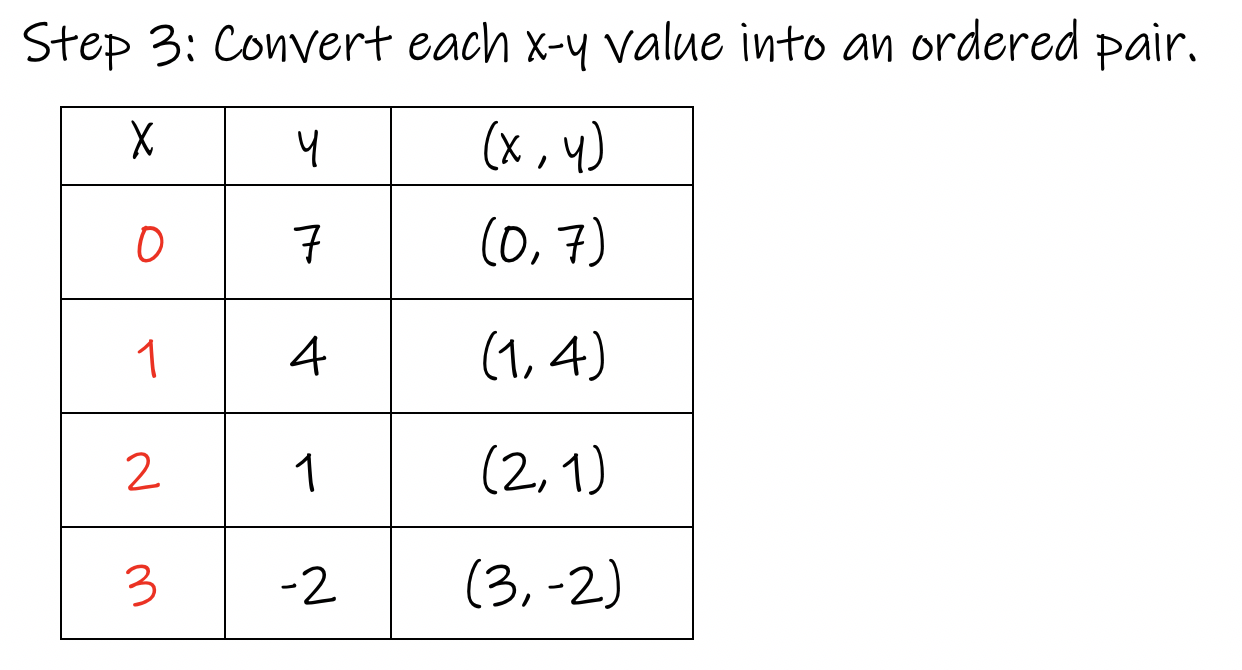
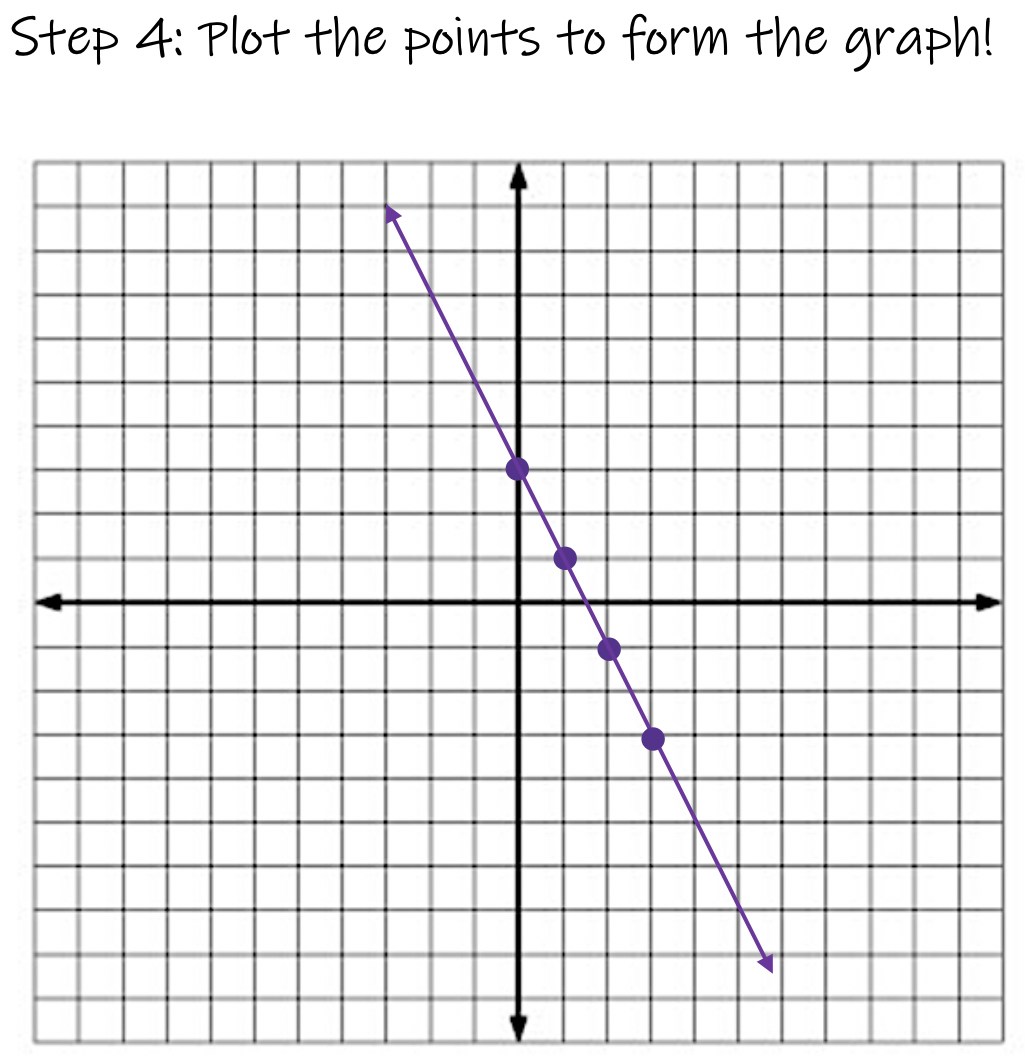
Example 3: graph y = -3x + 7.
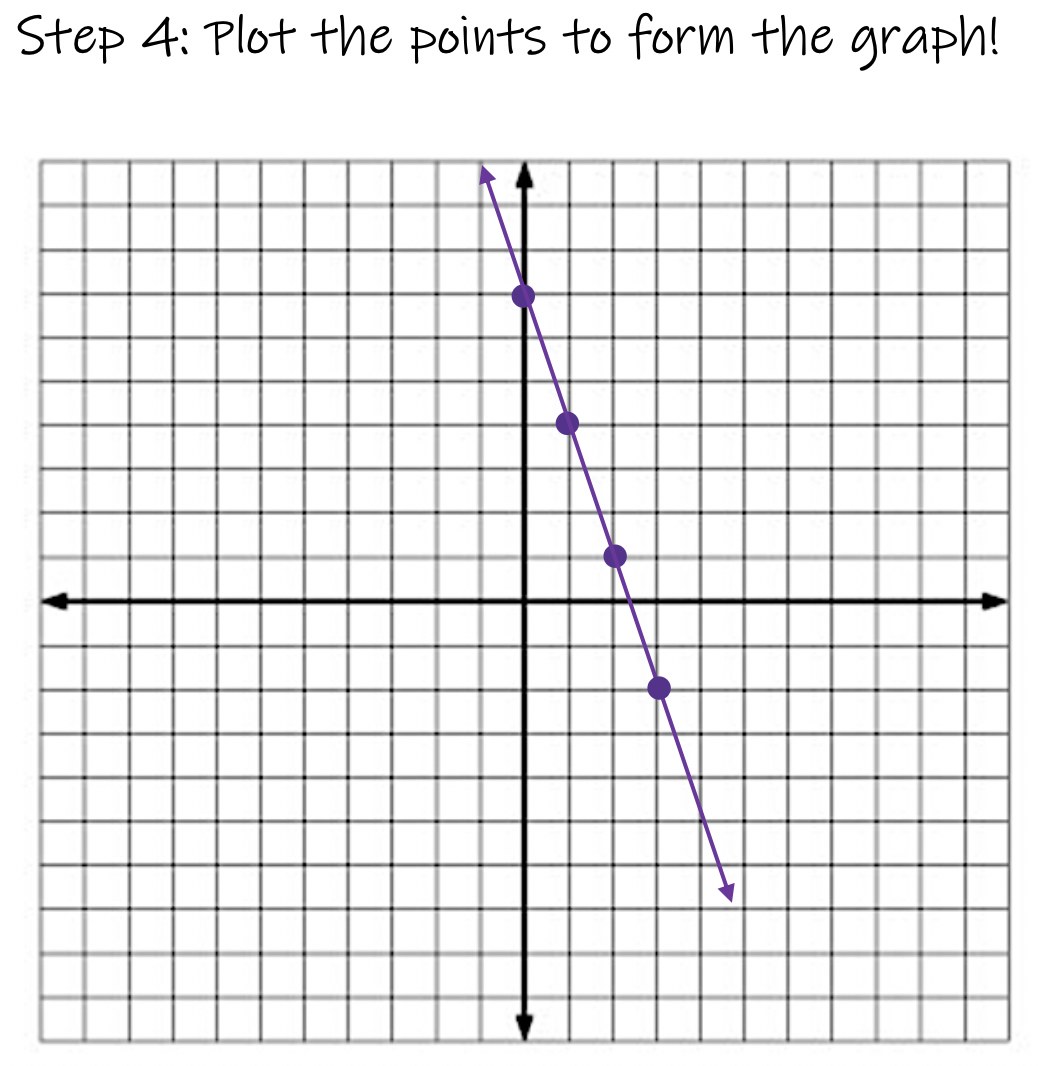
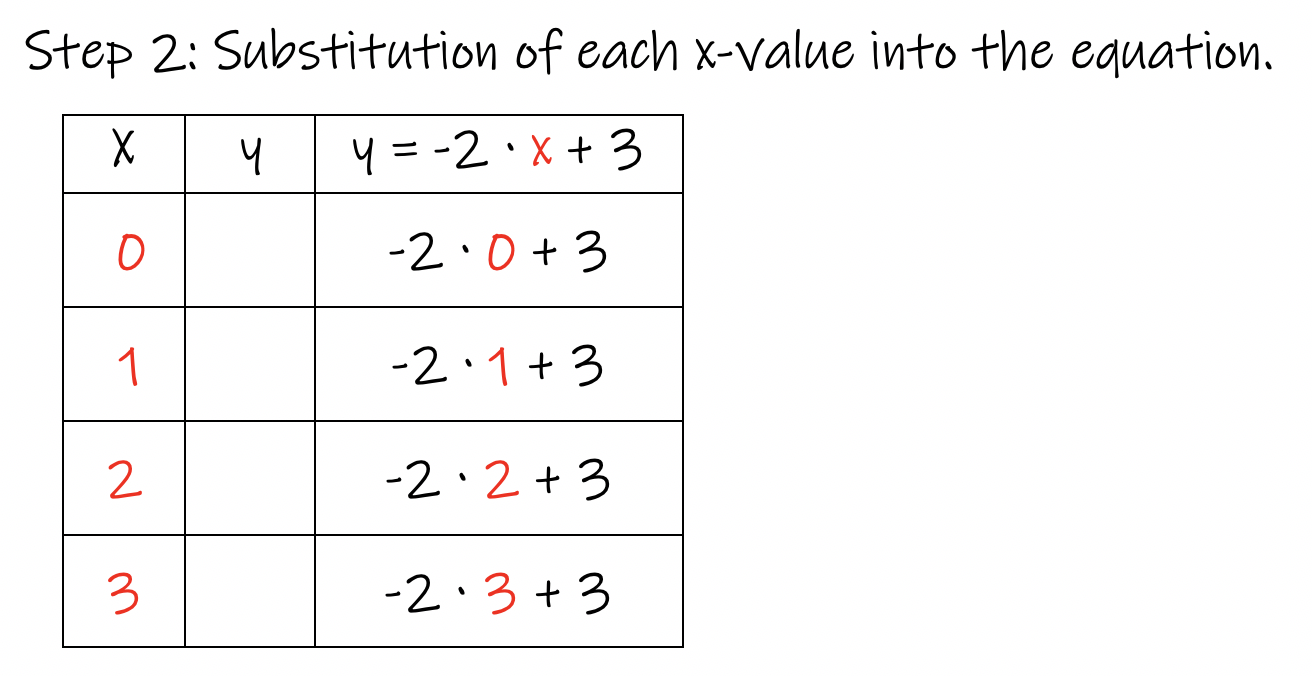
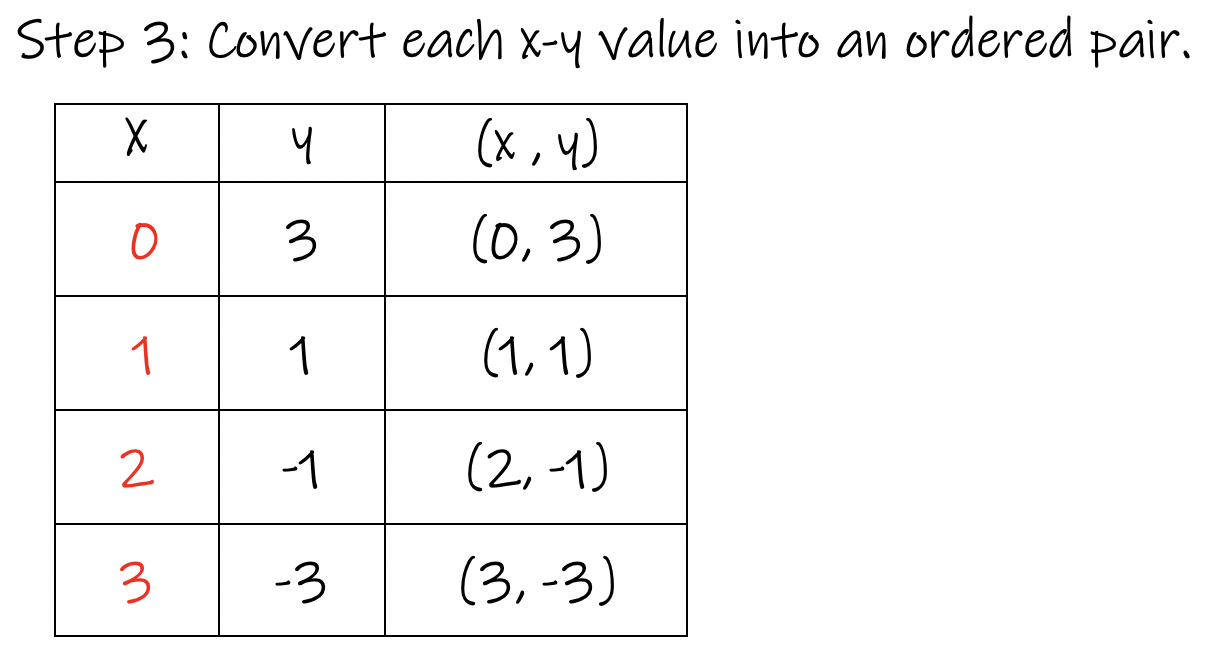
Example 4: graph y = -2x + 3.
The second method to graph a line is using the numbers they give you in the equation in order to graph the line.
It is harder at first, but it will save you time compared to making a table of values.
Let's look at an example:
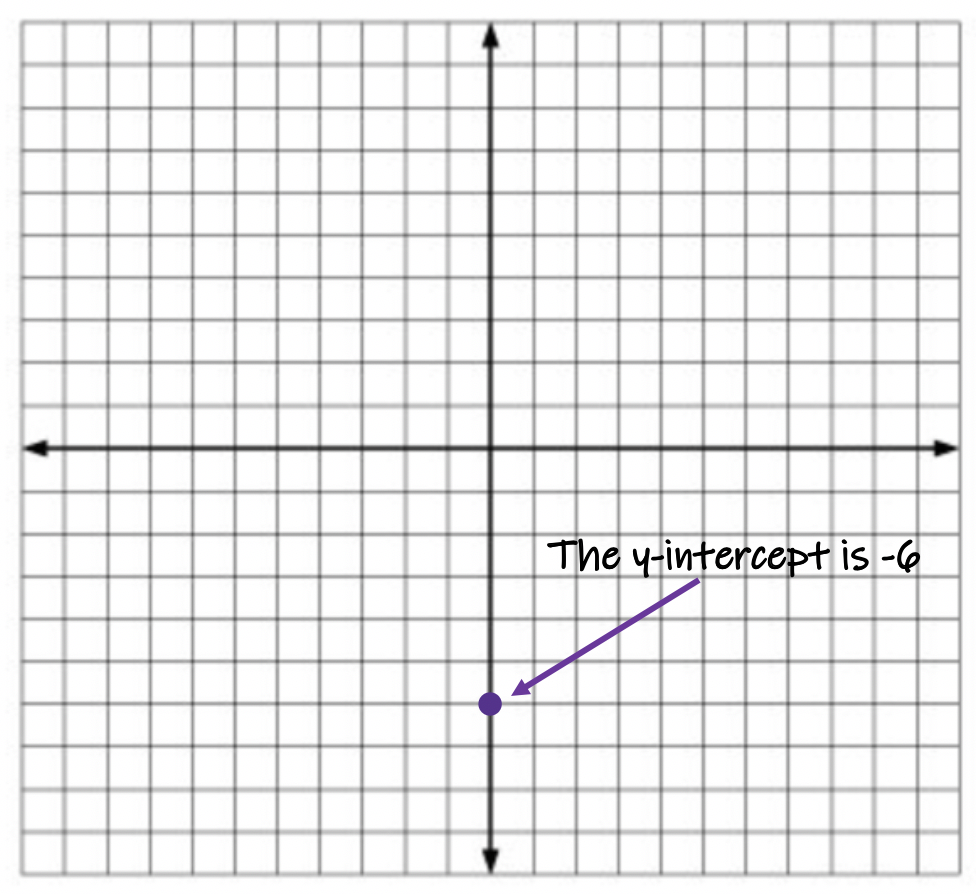
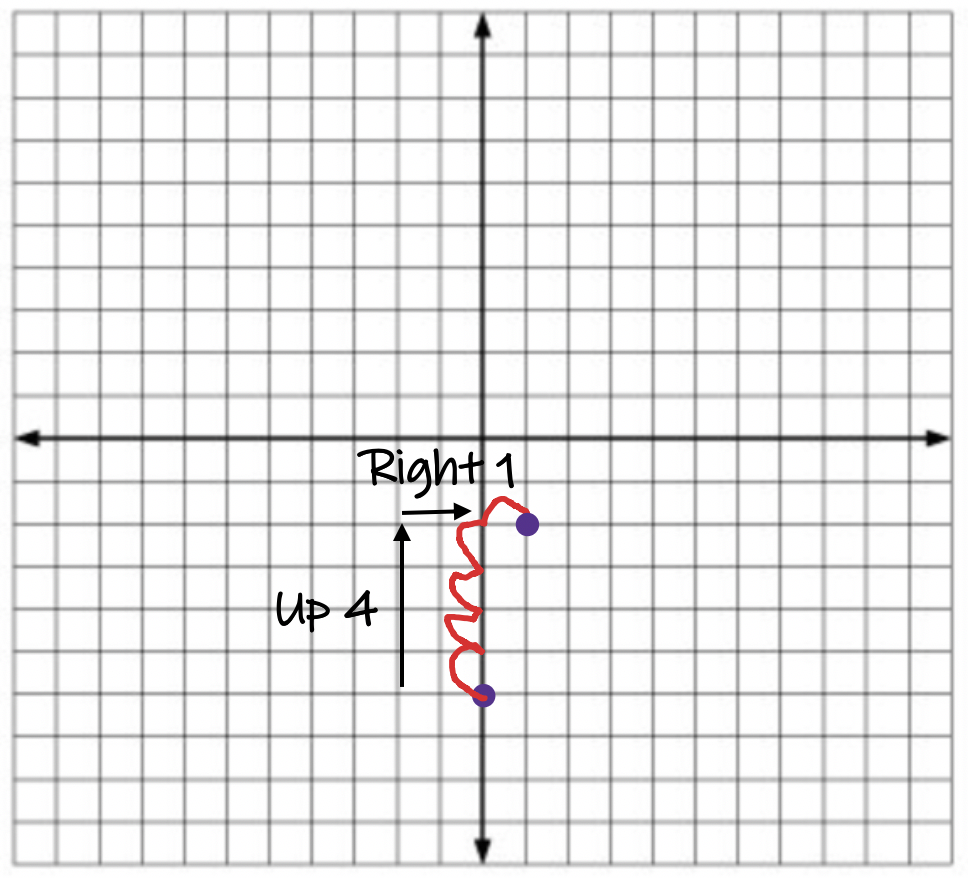
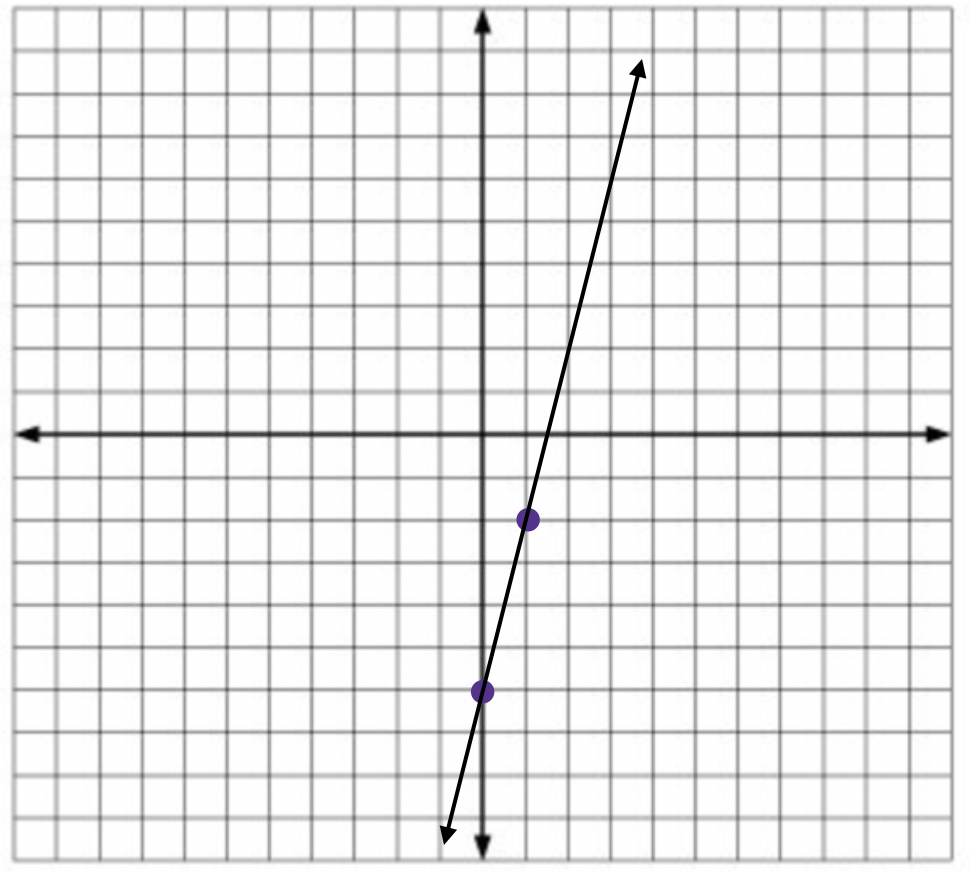
Graph y = 4x - 6
The slope is always the number infront of the variable x. The slope is 4.
The y-intercept is the number not with the variable x. The y-intercept is -6.
Let's look at an example:
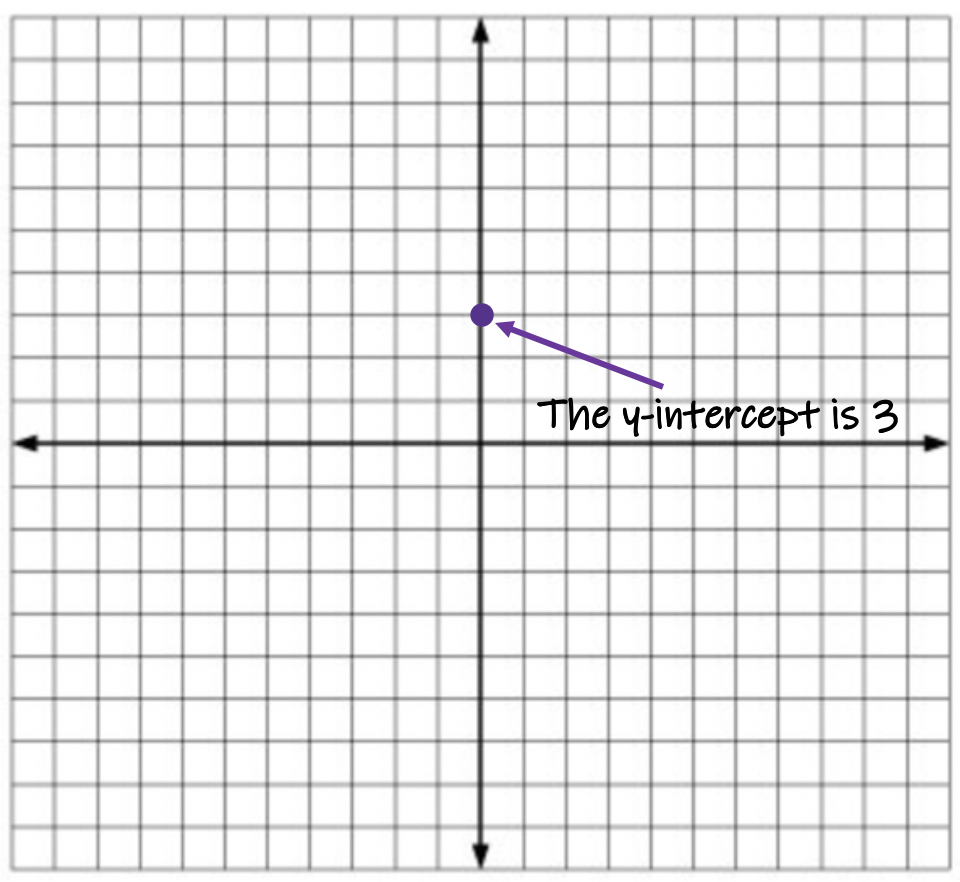
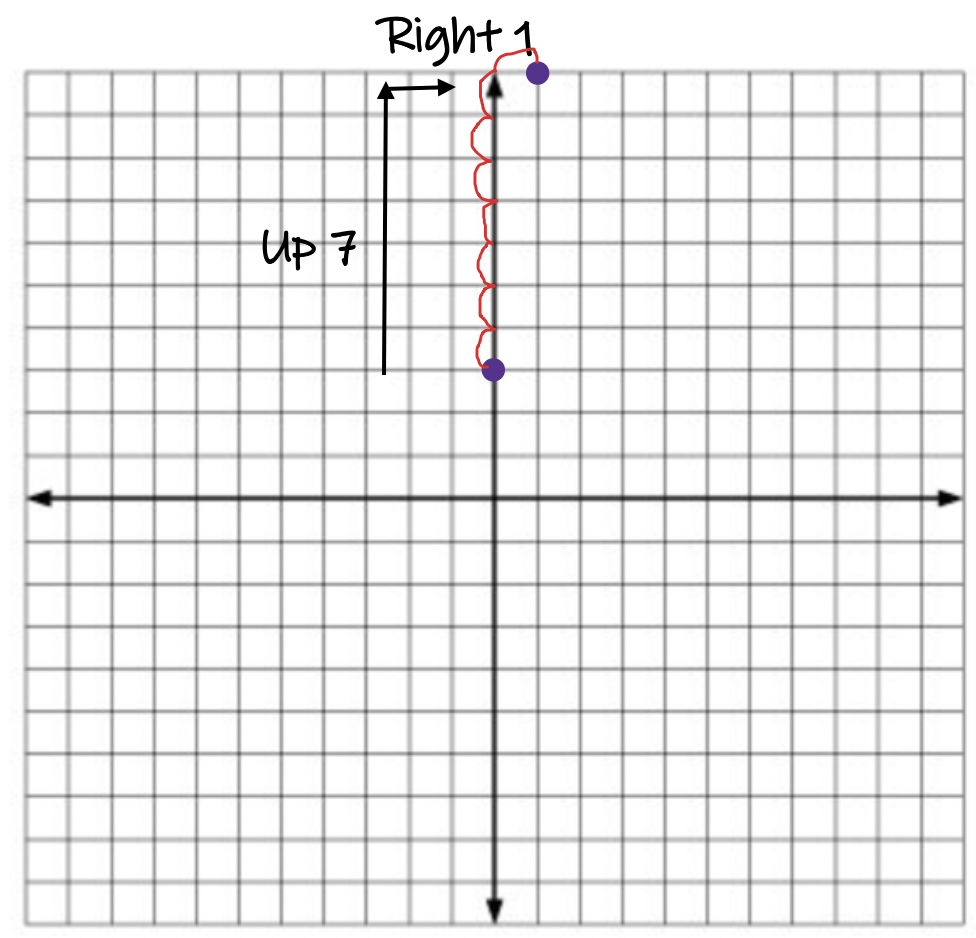
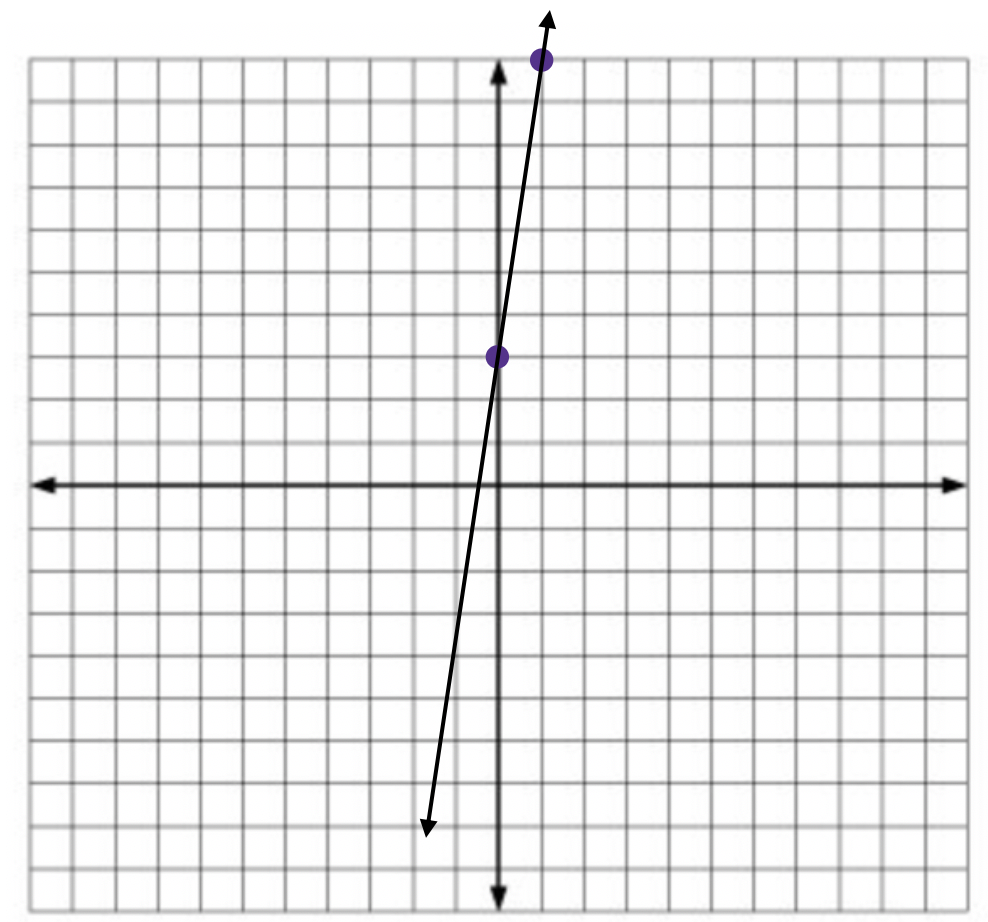
Graph y = 7x + 3
The slope is always the number infront of the variable x. The slope is 7.
The y-intercept is the number not with the variable x. The y-intercept is 3.
Let's look at an example:
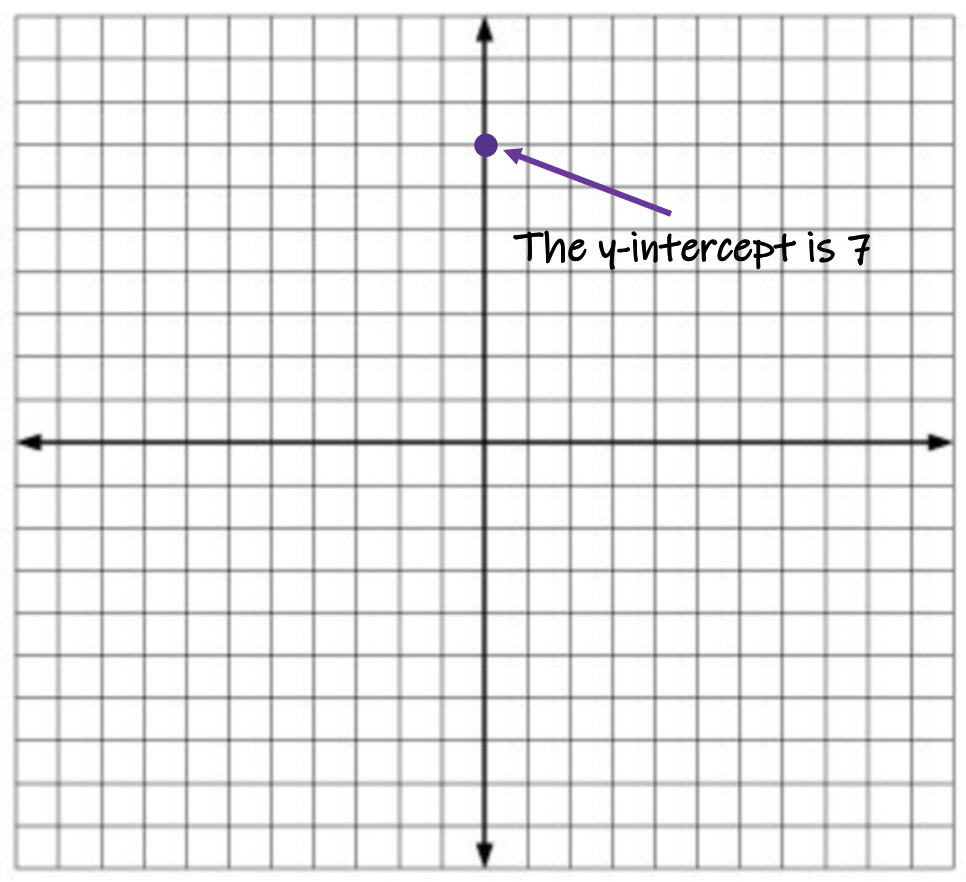
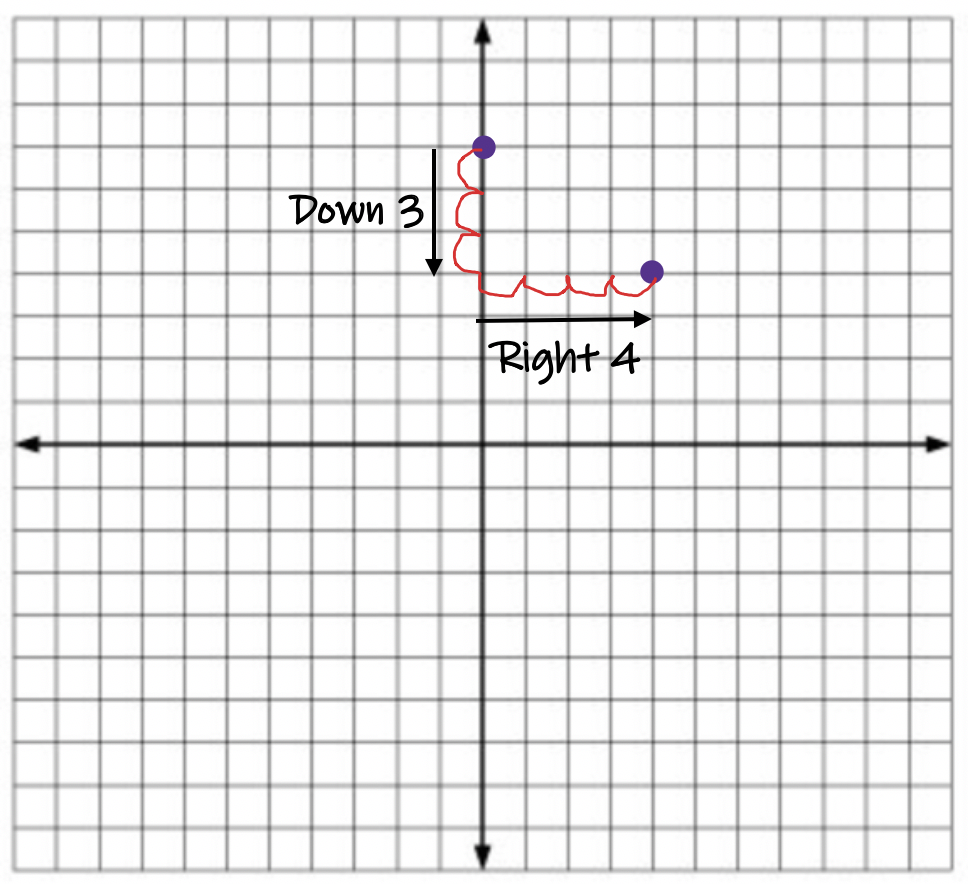
Graph y = -3/4x + 7
The slope is always the number infront of the variable x. The slope is -3/4.
The y-intercept is the number not with the variable x. The y-intercept is 7.
Let's look at an example:
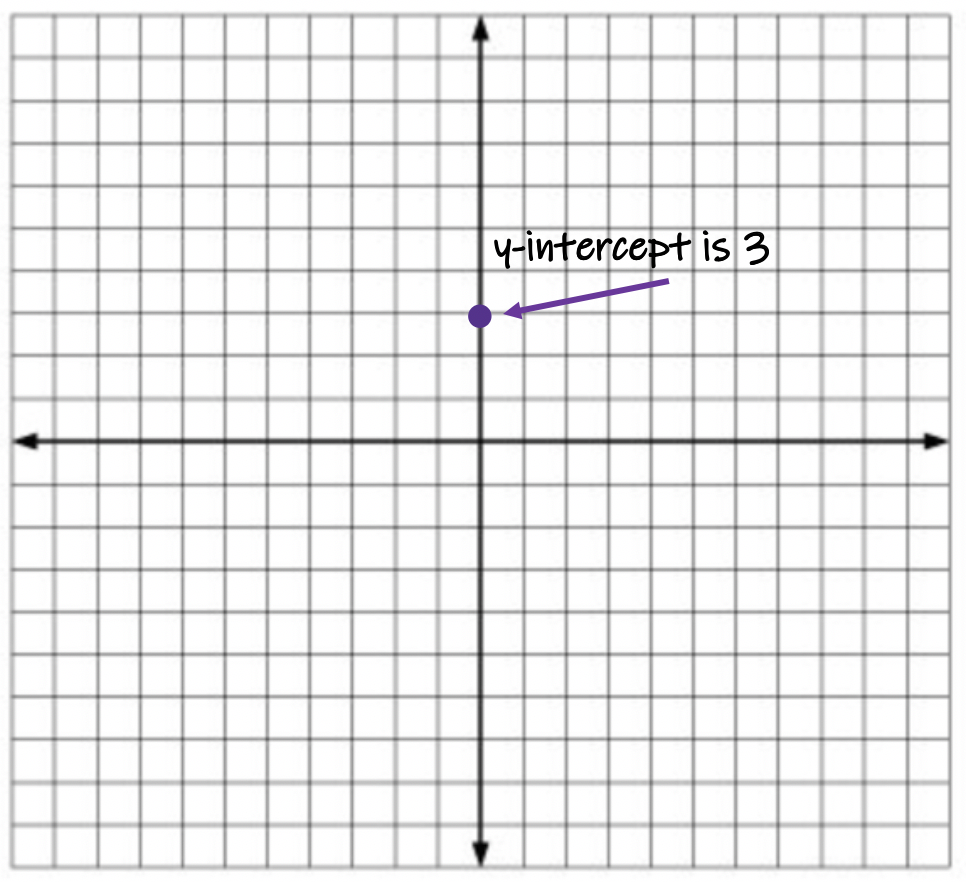
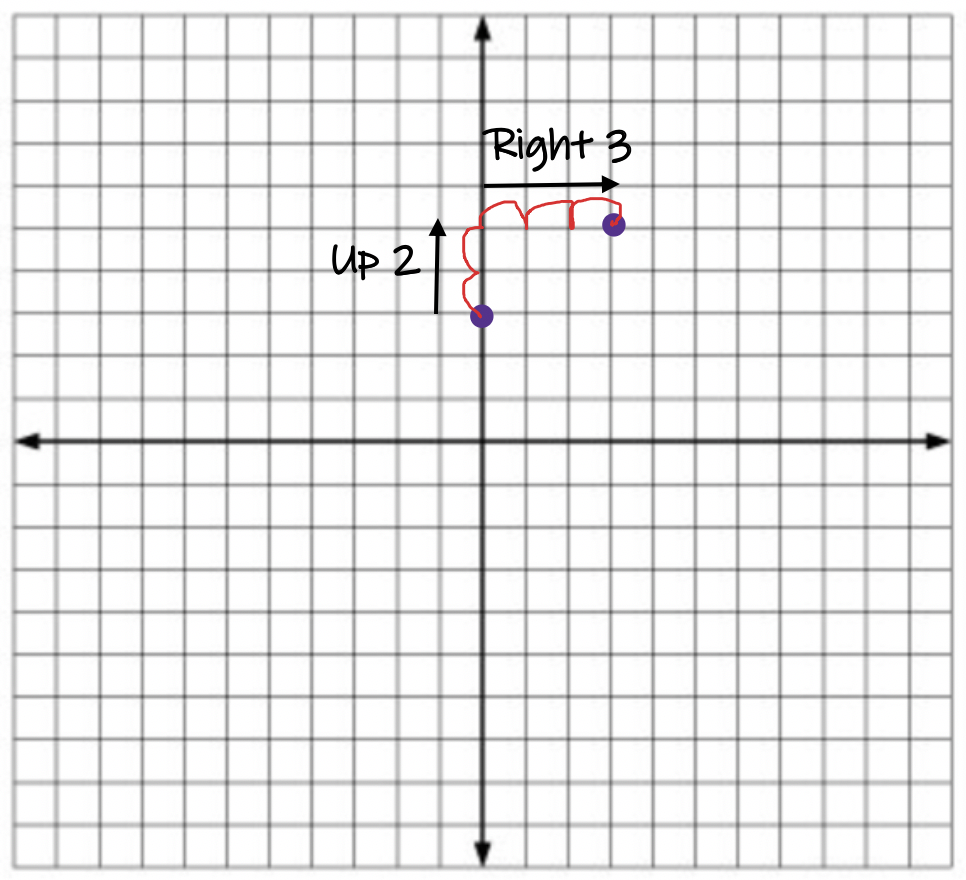
Graph y = 2/3x + 3
The slope is always the number infront of the variable x. The slope is 2/3.
The y-intercept is the number not with the variable x. The y-intercept is 3.
The difficult part to remember using this method is when adding the slope to the graph. I gave 4 different examples. Each one had slope. But 2 were fractions and 2 were whole numbers.