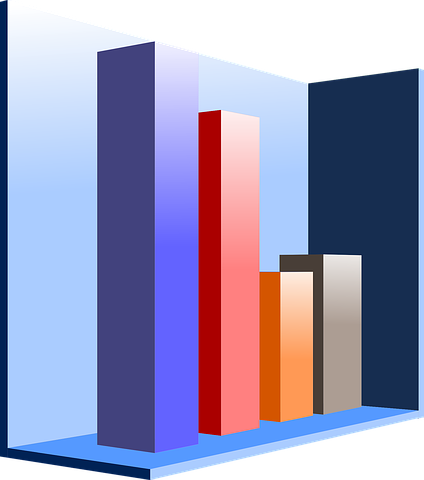
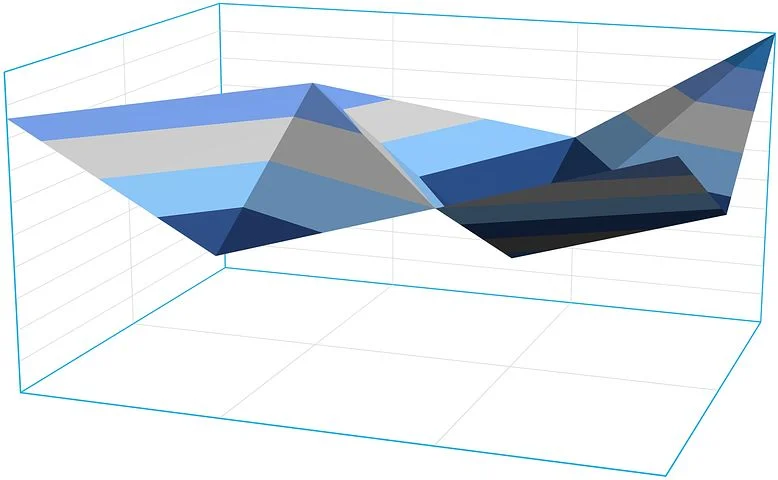
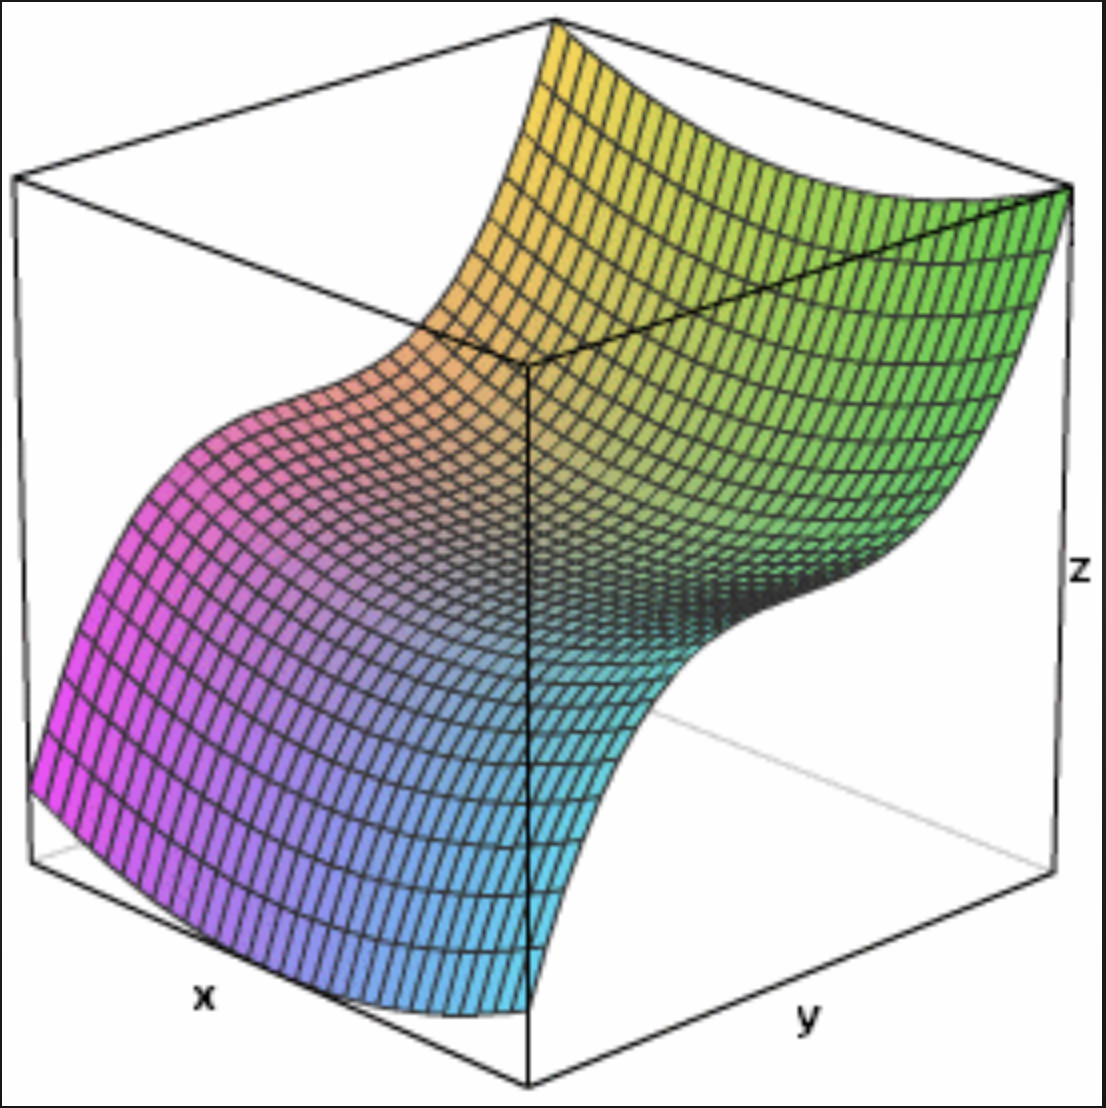
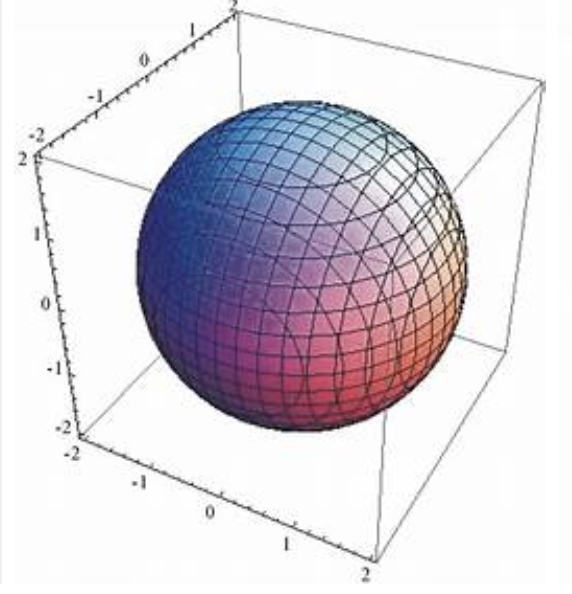
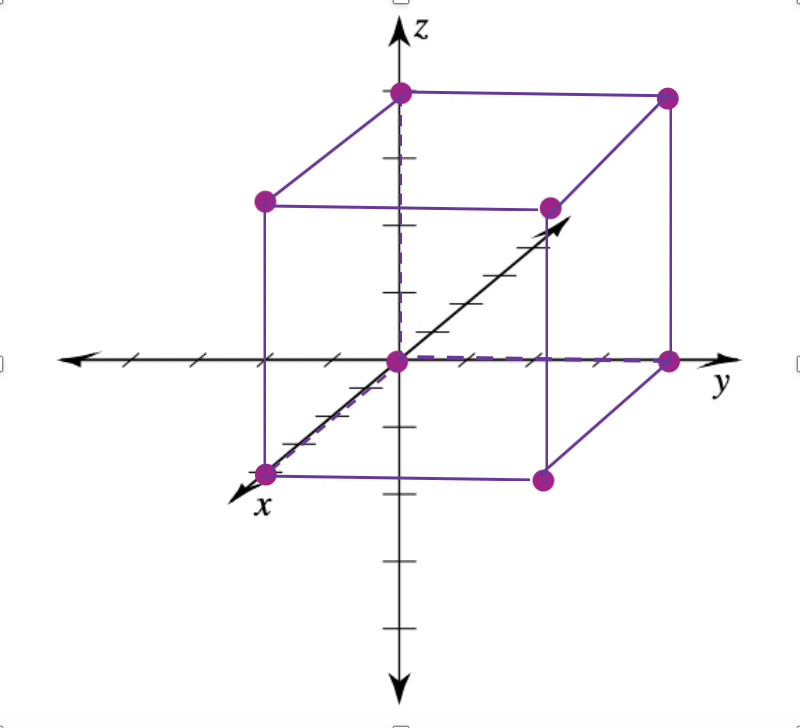
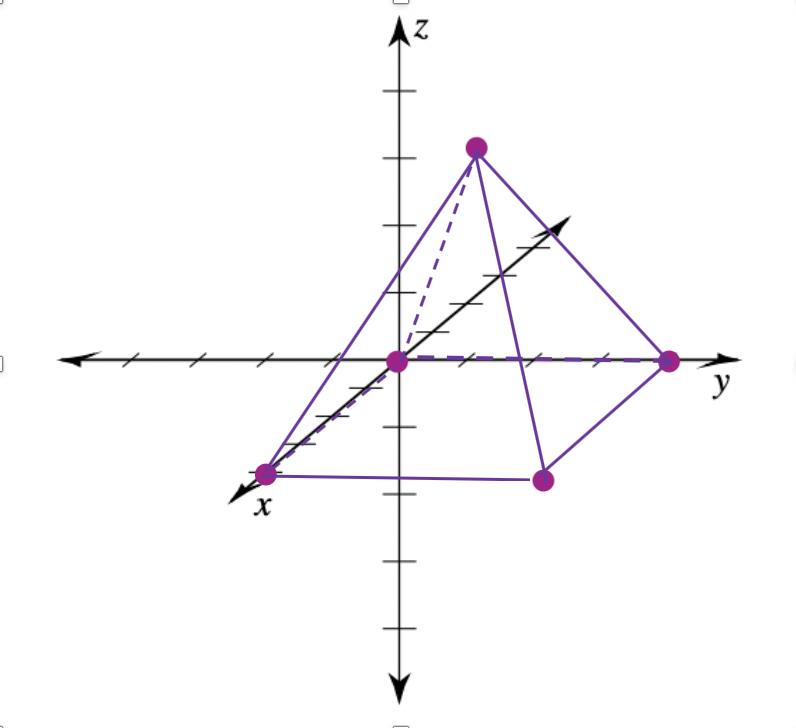
In this module we will cover how to plot three-dimensional graphs. Some examples are shown below.
It becomes necessary to be able to examine three-dimensional shapes because most items in the real-world are three dimensional. Graphing with an x-y coordinate plane only gives us the ability to work with two-dimensional objects. That's great for squares and circles, but what about Rectangular Prisms or Spheres? Therefore, three-dimensional graphing was created.
The difference between 2D and 3D Graphing is:
2D graphing uses (x, y) ordered pairs that correspond to an x-y axis. 3D graphing uses 3 ordered pairs represented as (x, y, z) which correspond to an x-y-z coordinate plane, shown below.
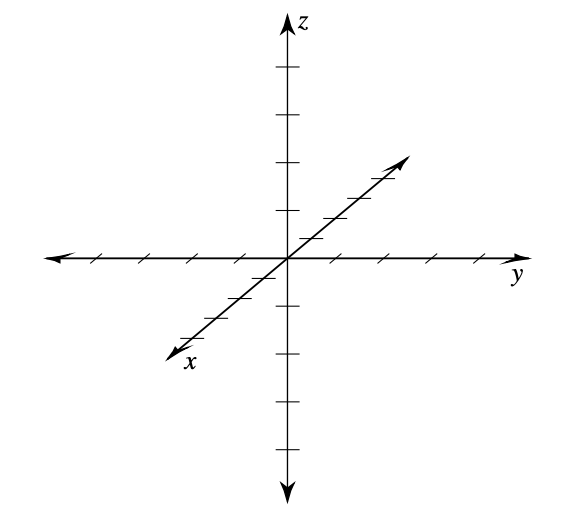
The (x, y, z) Coordinate Plane
The x-y-z axis is similar to the x-y coordinate axis, as the x-and y-axis are still a part of the graph. Instead of it facing at you like the 2D graph does, in 3D, the x-and y-axis are horizontal or flat, the z-axis is the vertical axis.
Graphing Ordered Pairs
Just as with 2D graphing, 3D graphing has 3 axes that each correspond with its ordered pair.
To plot the
x-coordinate: move forward if it is positive or backwards if it is negative.
y-coordinate: move right if it is positive, left if its negative.
z-coordinate: move up if it is positive and down if it's negative.
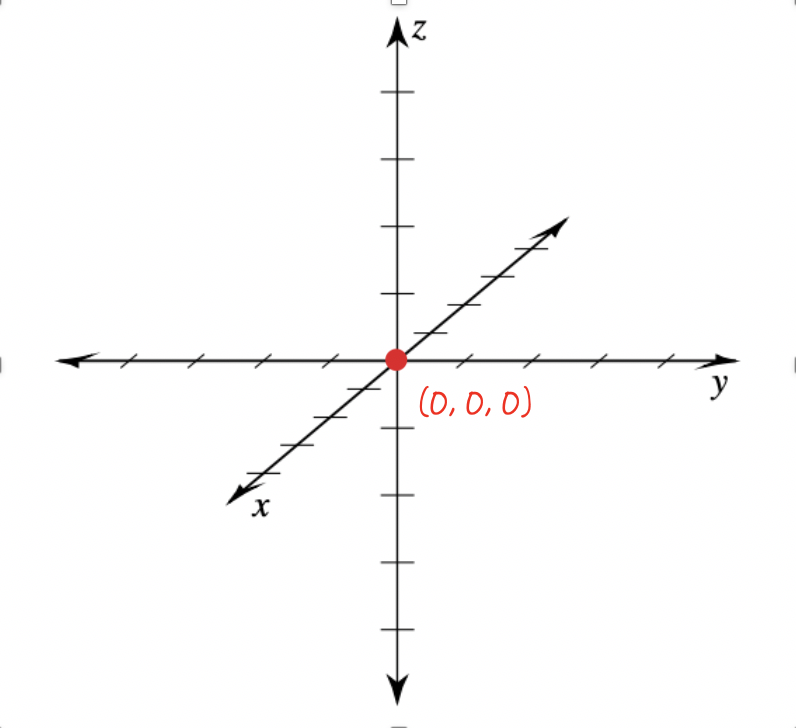
Then place a dot at the final location; after all three moves are made. Follow the picture which has the axes labeled with x, y, and z. The ordered pairs correspond to their axes.
Always start with your pencil at the Origin (0, 0, 0).
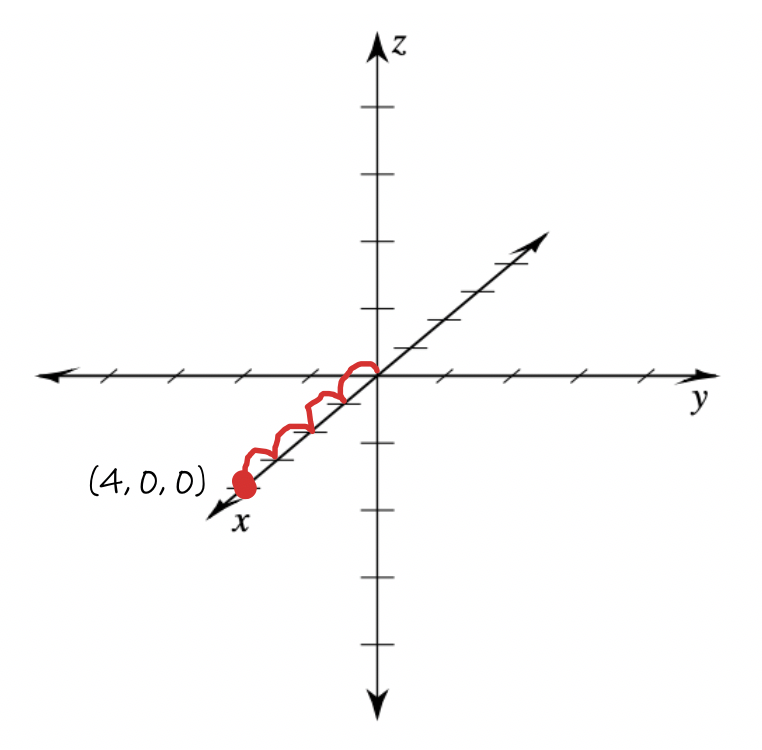
Example 1: Plot the point (4, 0, 0).
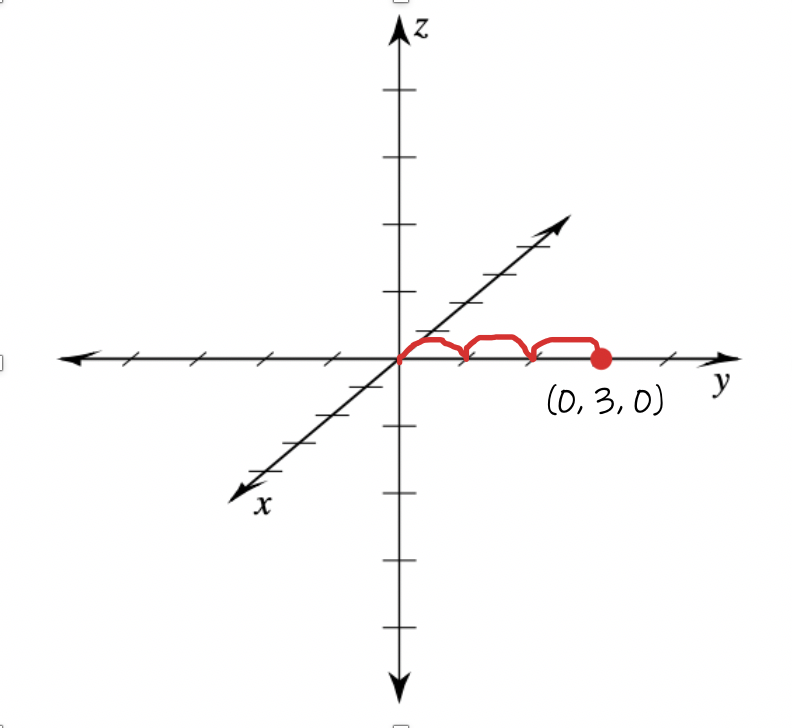
Example 2: Plot the point (0, 3, 0).
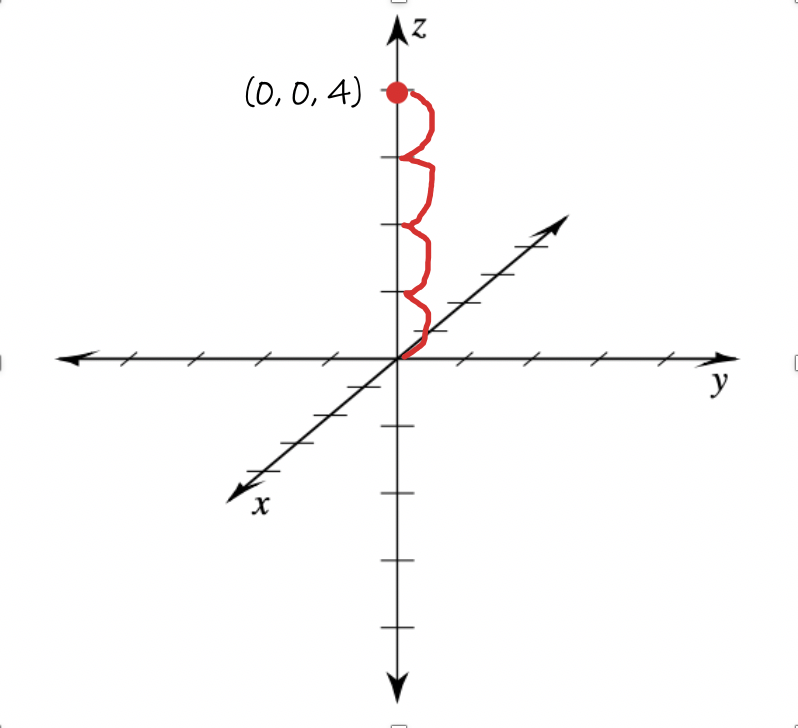
Example 3: Plot the point (0, 0, 4).
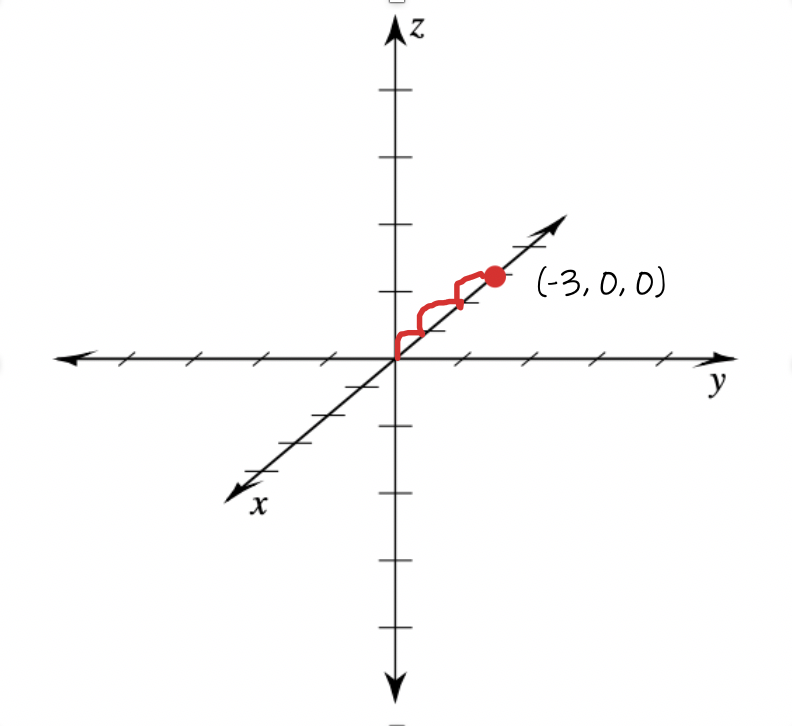
Example 4: Plot the point (-3, 0, 0).
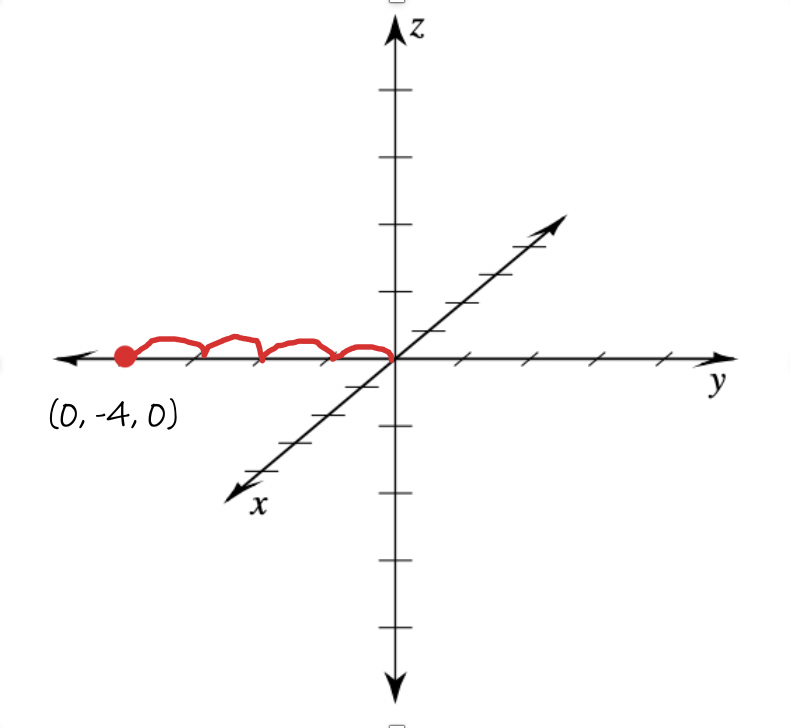
Example 5: Plot the point (0, -4, 0).
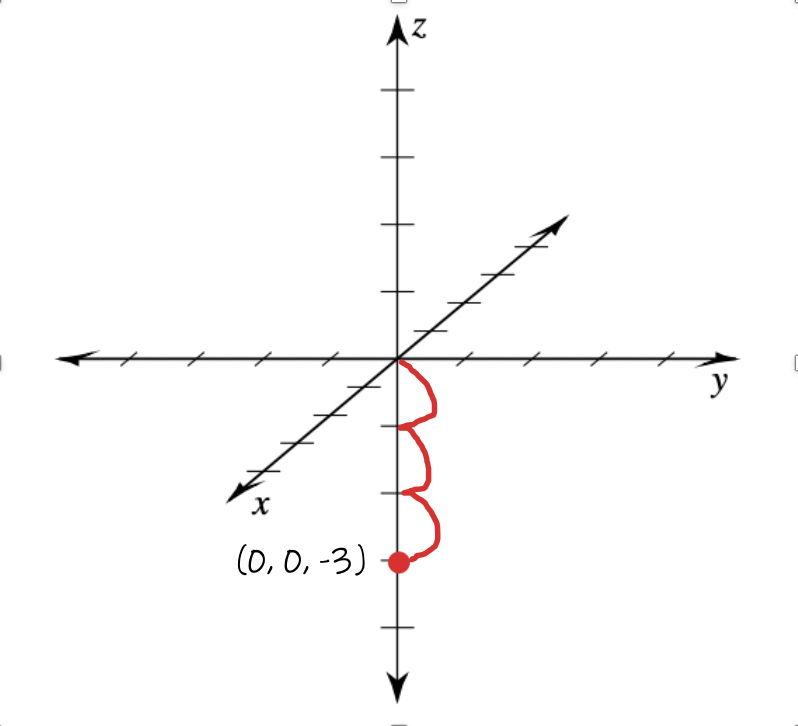
Example 6: Plot the point (0, 0, -3).
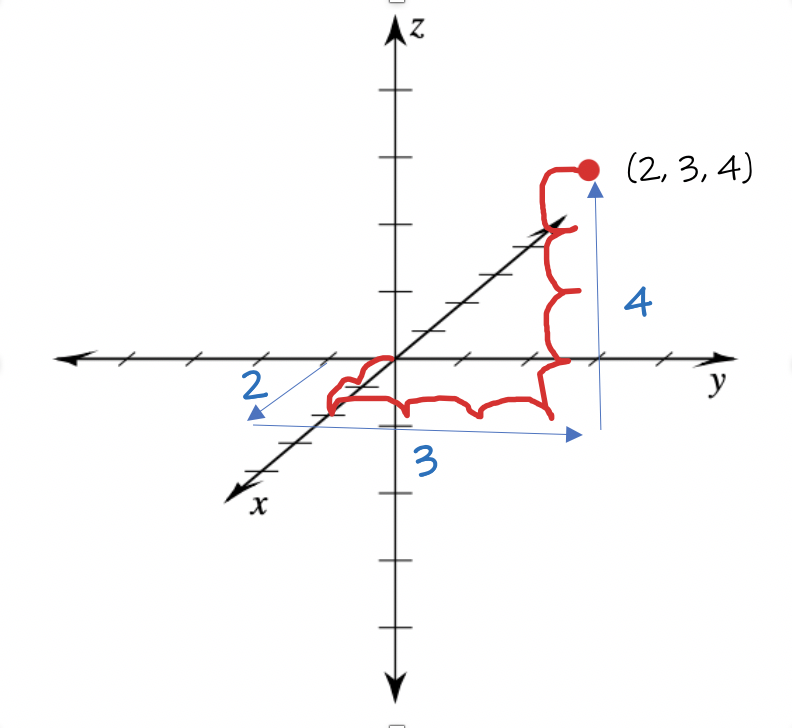
Example 7: Plot the point (2, 3, 4).
Forward 2, right 3, up 4
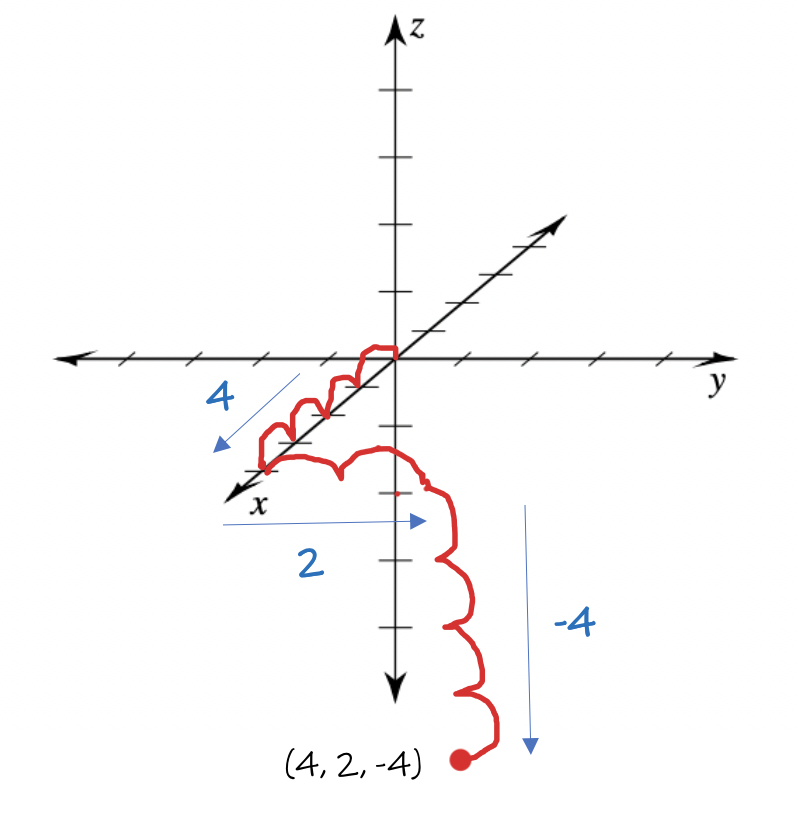
Example 8: Plot the point (4, 2, -4).
Forward 4, right 2, down 4